Coffee
No Haggl
33.3%$20.19 AOV
Haggl
50.0%$19.58 AOV
- Recommendation lift
- +50.0%
- AOV change
- -3.0%
Haggl research · 17 September 2026
We trained and froze a model for each of 15 categories, then compared the complete Haggl offer policy with ordinary retailer prices on fresh synthetic shoppers.
This is a controlled recommendation benchmark using actual shopping-agent decisions. The shoppers, stores, purchase histories and costs are fictional. No purchases occurred.
Synthetic agent benchmark
A matched comparison of retail and hospitality shopping tasks with and without Haggl.
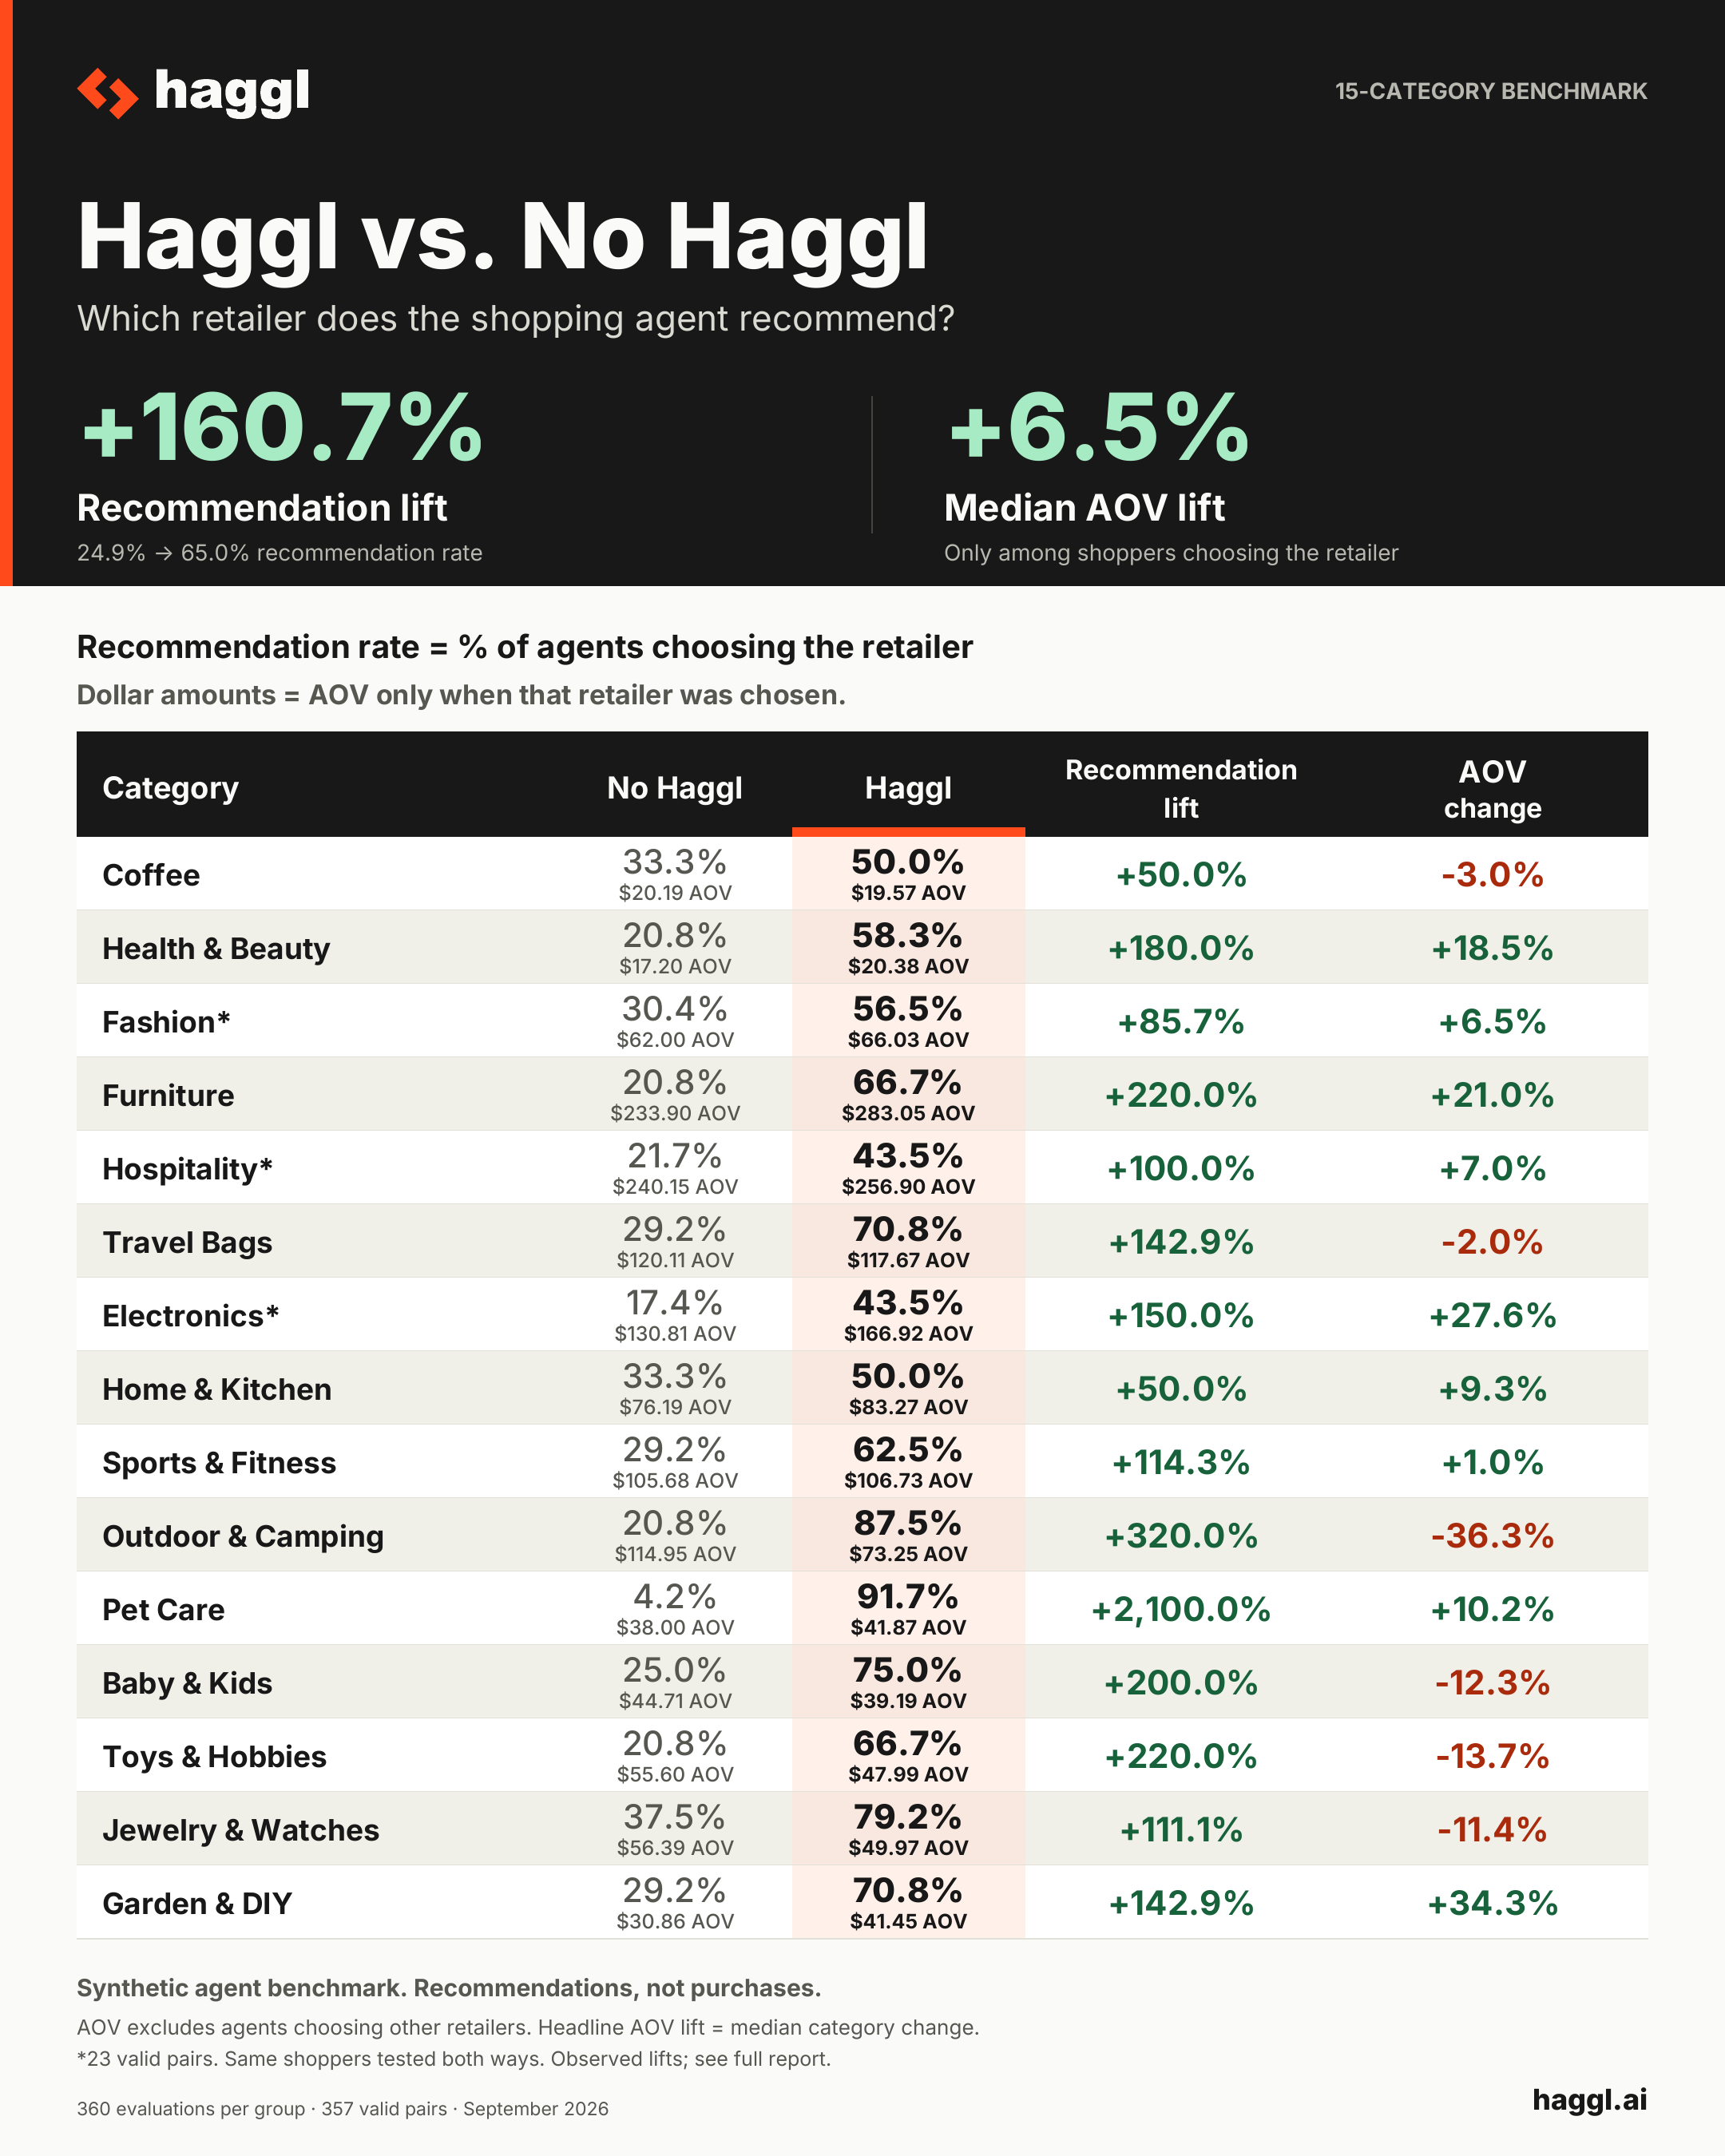
Each arm shows the share of agents recommending the retailer, with conditional AOV below: the average basket value only among agents choosing that retailer.
| Category | No Haggl | Haggl | Recommendation lift | AOV change |
|---|---|---|---|---|
| Coffee | 33.3%$20.19 AOV | 50.0%$19.58 AOV | +50.0% | -3.0% |
| Health & Beauty | 20.8%$17.20 AOV | 58.3%$20.38 AOV | +180.0% | +18.5% |
| Fashion* | 30.4%$62.00 AOV | 56.5%$66.03 AOV | +85.7% | +6.5% |
| Furniture | 20.8%$233.90 AOV | 66.7%$283.05 AOV | +220.0% | +21.0% |
| Hospitality* | 21.7%$240.15 AOV | 43.5%$256.90 AOV | +100.0% | +7.0% |
| Travel Bags | 29.2%$120.11 AOV | 70.8%$117.67 AOV | +142.9% | -2.0% |
| Electronics* | 17.4%$130.81 AOV | 43.5%$166.92 AOV | +150.0% | +27.6% |
| Home & Kitchen | 33.3%$76.19 AOV | 50.0%$83.27 AOV | +50.0% | +9.3% |
| Sports & Fitness | 29.2%$105.68 AOV | 62.5%$106.73 AOV | +114.3% | +1.0% |
| Outdoor & Camping | 20.8%$114.95 AOV | 87.5%$73.25 AOV | +320.0% | -36.3% |
| Pet Care | 4.2%$38.00 AOV | 91.7%$41.87 AOV | +2100.0% | +10.2% |
| Baby & Kids | 25.0%$44.71 AOV | 75.0%$39.19 AOV | +200.0% | -12.3% |
| Toys & Hobbies | 20.8%$55.60 AOV | 66.7%$47.99 AOV | +220.0% | -13.7% |
| Jewelry & Watches | 37.5%$56.39 AOV | 79.2%$49.97 AOV | +111.1% | -11.4% |
| Garden & DIY | 29.2%$30.86 AOV | 70.8%$41.45 AOV | +142.9% | +34.3% |
Methodology
Four competing fictional stores and eight shopping situations per category: 60 stores, 720 products and services, and 810 personas. Hospitality uses complete stays, occupancy limits, cancellation terms, taxes and mandatory fees.
450 training tasks were attempted. The models used 447 valid shopping decisions; three startup failures were retained. Each decision supplied four correlated retailer views, not four independent shoppers. All 15 models and the offer policy were frozen before evaluation.
24 fresh shoppers per category evaluated each condition in separate contexts: 360 evaluations without Haggl and 360 with Haggl. The same shoppers, catalogs and target stores were paired, with six shoppers per target store. Identical buyer inputs shared one saved response.
717 of 720 evaluation outcomes were valid, leaving 357 complete pairs. One invalid response each in fashion, hospitality and electronics left those categories with 23 pairs. Errors were not turned into zero recommendations or silently retried after the single allowed repair.
Nine categories met the prespecified positive threshold for value per task, three were inconclusive and three had incomplete valid pairs. The green lifts in the summary show the direction of observed changes; they are not significance labels.
Intervals use 20,000 paired shopper bootstrap draws. The adjusted intervals use Bonferroni alpha 0.05/15 across the 15 primary comparisons. Small cohorts and percentile-bootstrap tails make this adjustment approximate. A positive finding requires all 24 valid pairs and an adjusted lower bound above zero.
| Category | Pairs | No Haggl | Haggl | Difference | 95% interval | Adjusted interval | Finding |
|---|---|---|---|---|---|---|---|
| Coffee | 24/24 | $6.73 | $9.79 | $3.06 | $0.33 to $6.36 | -$0.58 to $8.15 | inconclusive |
| Health & Beauty | 24/24 | $3.58 | $11.89 | $8.30 | $3.52 to $13.30 | $1.28 to $15.80 | positive |
| Fashion | 23/24 | $18.87 | $37.32 | $18.45 | $0.24 to $36.34 | -$9.26 to $45.19 | incomplete |
| Furniture | 24/24 | $48.73 | $188.70 | $139.97 | $74.43 to $209.75 | $42.36 to $240.09 | positive |
| Hospitality | 23/24 | $52.21 | $111.69 | $59.49 | $12.66 to $113.15 | -$5.82 to $140.73 | incomplete |
| Travel Bags | 24/24 | $35.03 | $83.35 | $48.32 | $23.30 to $75.65 | $12.36 to $89.92 | positive |
| Electronics | 23/24 | $22.75 | $72.57 | $49.82 | $15.85 to $88.13 | $3.59 to $109.46 | incomplete |
| Home & Kitchen | 24/24 | $25.40 | $41.63 | $16.24 | $0.96 to $34.16 | -$5.49 to $43.09 | inconclusive |
| Sports & Fitness | 24/24 | $30.82 | $66.71 | $35.89 | $12.54 to $64.17 | $4.12 to $81.53 | positive |
| Outdoor & Camping | 24/24 | $23.95 | $64.09 | $40.14 | $23.67 to $57.45 | $15.66 to $66.33 | positive |
| Pet Care | 24/24 | $1.58 | $38.38 | $36.80 | $29.15 to $44.03 | $25.12 to $47.20 | positive |
| Baby & Kids | 24/24 | $11.18 | $29.40 | $18.22 | $7.72 to $28.70 | $2.66 to $33.85 | positive |
| Toys & Hobbies | 24/24 | $11.58 | $31.99 | $20.41 | $9.14 to $33.00 | $4.36 to $39.97 | positive |
| Jewelry & Watches | 24/24 | $21.15 | $39.56 | $18.41 | $0.14 to $34.84 | -$10.38 to $42.55 | inconclusive |
| Garden & DIY | 24/24 | $9.00 | $29.36 | $20.36 | $8.72 to $33.95 | $4.67 to $41.49 | positive |
Evidence for the combined Haggl offer policy under the disclosed synthetic retail and hospitality conditions. It does not establish real-world sales, LTV, universal shopping-agent compatibility, or the incremental benefit of ML alone. It also does not test SaaS, utility or financial-service purchases.
Every category is reported, including AOV declines. Training and test personas were disjoint, but predefined shopping situations recur. The small samples do not represent all shoppers or merchants. A separate statistical calculation reproduced the category estimates and intervals; an audit checked saved agent responses, quotes, frozen sources and model hashes.
Three early training attempts failed because concurrent processes shared a temporary instruction file. Those failures were retained and an operational amendment isolated subsequent shopper processes before evaluation. No catalogs, prompts, offer policy or statistical rules were changed using test outcomes.